Image: “74/365: Falling cards” by Michael Scott on flickr.
I spent the last week of summer in the Rocky Mountains with my family. We rented a little Wild-West-themed house overlooking the national park. Among the toy pistols and copper pots, my siblings found a deck of cards.
The three of them decided to play Go Fish. Each person drew seven cards. Then my brother announced a rule: if anyone draws three of the same card (like three 8’s), return your cards and shuffle the deck. His reasoning was that getting dealt a triple is a weird anomaly, so if it happens, the deck is probably not shuffled well and the game won’t be fair.
I was suspicious of that. My hunch was that a triple isn’t actually so rare. So how could we resolve this dispute? What are the actual odds of getting a triple if the deck is shuffled randomly?
And, perhaps more interestingly, how would you go about figuring that out?
Option 1: Just do it ten million times
Okay, not really. But let’s say we could shuffle and deal the cards 10,000,000 times. Then we would have a way to guess the probability for next time.
If I’ve been to the grocery store 100 times, and apples were on sale 20 of those times, I can guess how likely it is that apples will be on sale next time I go to the store. Based on my experience, there is roughly a 20/100 (i.e. 20 out of 100; that is, 20%) chance of an apple sale.

This is actually one of the ways we predict the weather: meteorologists run multiple simulations and see what results from each one.
So if I deal 100 hands and 9 of them have a triple, my best guess would be that there is a roughly 9/100 chance (or 9% chance) of me drawing a triple. If I deal 10,000 hands and 681 have a triple, then my new best guess would be a 681/10,000 chance (or 6.81% chance).
On the airplane ride home from our vacation, I wrote this piece of code. Essentially, it simulates drawing a random 7-card hand from a 52-card deck. On the plane, I ran the simulation 10,000,000 times, and had the program tell me what percentage of those hands draws a triple.
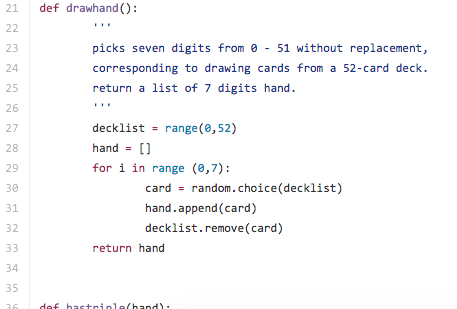
See GitHub for the rest of the code.
It turns out you get a triple about 7.7% of the time, which isn’t likely, but hardly impossible. For comparison, the odds of rolling snake eyes (two 1’s) on a pair of dice is about 2.8%. That’s a lot less. Can you imagine a rule that forced you to re-roll after getting snake eyes, because it was an unlikely roll and so the dice must be rigged?
Okay, so we’ve got an estimate.
Is that the best we can do?

As an aside, this dice drawing video was pretty cool.
Option 2: Figure it out abstractly
There are lots of mathematical tools to answer questions like this. We want to know how likely it is that a random 7-card hand from a 52-card deck will have three cards with the same number value. It helps to know that every hand is equally likely: it’s just as likely to draw an ace of spades as it is to draw a ten of diamonds, and so on.
Let’s first think about a simpler case. Imagine there were only 10 possible hands, all equally likely, and 4 of those hands contained a triple. Now I draw a hand. How likely is it that my hand contains a triple?

Well, it’s going to be one of the 10 possible hands, and 4 out of 10 of those hands contain a triple. This translates into a 4 in 10 chance– that is, a .4, or 4/10, or 40% chance– that my hand contains a triple. This kind of reasoning is an example of something called discrete probability.
We’re dealing with the exact same situation here. The only difference is that there are a lot more than 10 possible hands. All we need to do is count two things: how many hands there are all together, and how many hands have a triple.
It turns out that those are both huge numbers. They are way too big to count easily. But there are some simple formulas that people developed to help figure this out. Like many formulas, they are really just shorthand for a bigger idea. In particular, we’d like to use combinations. Combinations are a basic tool in the field of combinatorics. Combinatorics deals, in part, with the ways that things can be counted or arranged– some classic examples are ways to draw cards from a deck, seat people around a table, or pick marbles from a bowl.
Below is the first of several Khan Academy videos explaining combinations. It’s part of a larger series on probability and combinatorics.
For us, instead of choosing people to sit at a table, we’re choosing cards from a deck to sit in our hand, but mathematically it’s the same idea.
So to get an exact answer, I used combinations to count the total number of hands, as well the total number of hands with triples. Once I figured out what I needed to compute, I put those numbers into this calculator, because working out (52 choose 7)? Not going to happen.
Guess what? The exact answer really is about 7.7%. Cool!
But which way is better?
Option 2, the math way, is exact. It’s provable. And it tells you why the probability is that way– you use real information about the deck: which hands have triples, which don’t, and how many possible hands there are all together.
But what if we were dealing with something more complicated? For example, if you have three players, how likely is it to get a triple in at least one of the three hands? It’s certainly possible, and worthwhile, to figure that out abstractly. But it’s not as easy. Yet with one quick tweak, the computer program from Option 1 can deal with that scenario easily. An approximate, computational approach is sometimes more flexible than a direct one, and can be used to make educated guesses when we haven’t quite figured out the math yet.
And what if I’m dealing with something way more complicated, like the weather? We use computer simulations to deal with probabilities we don’t know how to describe perfectly, like the chance that it will rain tomorrow.
The answer, really, is that you need both. This is true not just in probability, but in lots of areas that use both math and computer science. Sometimes it’s the right time for approximations and simulations, and sometimes it’s the right time for pure math. But very often, in areas like machine learning and data science, the best approach is a balance between the two.

By Tomruen – Own work, CC BY-SA 4.0, Link
Postscript: Okay, but is the deck rigged?
There is one last step you need to really figure out if the deck is fair: applying Bayes’ theorem. I’m not going to explain this theorem in full, as it probably deserves its own post. But I think it’s necessary to mention, for completeness.
If you get dealt a triple, you might want to know how likely it is that the deck is rigged. That’s a slightly different question than how likely it is to get a triple from a fair deck. To figure this out, you need some other information: how likely it normally is that the deck is rigged, and how likely it is to get a triple from a rigged deck.
Without going into too much detail, though, this step still tells us that the deck is probably not rigged. If you’re interested in how this kind of reasoning works, check out these examples, or just ask me.
It would seem to me that you are implicitly working with a frequentist interpretation of probability. Until recently, I would not have noticed this nuance. In the statistics community, there are two primary approaches to probability: 1) frequentist, and 2) bayesian. Understanding the difference gave me a lot of clarity on the applications of probability and statistics.
Under the frequentist regime, when we say that an outcome has a probability p of occurring, the *definition* of this statement is that if we repeated the experiment (e.g., drawing a hand) infinitely many times, then a proportion p of the repetitions would result in that outcome. It is necessary to define probability in terms of infinite, long-term behavior, because, for any finite number of experiments I perform, there will always be some deviation from the idealized probability. Thus, e.g., a “40% chance“ can only be in reference to an infinite repetition of events. (Expected value should be interpreted similarly.) To sum up, frequentist probability deals with rates at which events occur.
The bayesian approach seeks to answer a different problem. If a doctor analyzes a patient and says that “the patient has a 40% chance of having the flu”, what does this mean? Certainly we cannot apply the frequentist interpretation: we cannot make infinitely many replicas of the patient, nor is there any reason to believe that different replicas of the patient would present with the same symptoms yet have varying underlying conditions! The bayesian approach applies in situations which are not repeatable. In such situations, we use probability to assess *uncertainty*, i.e., a degree of belief about the prediction in question. For example, a probability of 1 means we’re certain that the patient has the flu given her symptoms, probability 0 means we’re certain she doesn’t have the flu, and anything in between is a state of uncertainty about whether she has the flu.
To sum up: In the frequentist approach, we’re equipped with idealized, repeatable processes, and we want to calculate rates of specific events occurring. In the bayesian approach, we have in front of us non-repeatable evidence, and we need to quantify how (un)certain we are that the evidence suggests a specific outcome.
It is truly remarkable that the same theoretical tool, i.e., probability, can be used to model two completely different kinds of studies. More fundamentally stated, it has been shown that the same small set of common sense axioms yield the exact same probabilistic rules and formulas for both regimes. Thus, the probabilities for both regimes behave the same way quantitively. It is only in the qualitative realm, in interpretation and application, that the regimes differ drastically. For example, machine learning typically employs the bayesian approach. In that setting, we want to quantify how uncertain we are about whether the model we’re using is an accurate picture of reality. Moreover, we often want to use the model to make predictions given new, non-repeatable input.
I borrowed some of the above language from Deep Learning by Goodfellow et al., Chap. 3 (which, by the way, is a truly amazing book, and brand new). If you want to know more about frequentist vs. bayesian, there’s tons of stuff online.
Really interesting response. Thank you. I’ll definitely read about that more
The bayesian interpretation does make more sense in most contexts that I can think of, but would you apply it here? I would think that a frequentist approach makes more sense for something as contrived, and intentionally repeatable, as drawing cards.